Market Trends
Ahmedabad Real Estate Market 2026 Commonwealth Games Impact

23 Jan 2026
Market Trends
23 Jan 2026
Content
No Blogs content found
It looks like there haven’t been any blogs yet!
The property market in Ahmedabad just got a massive shot in the arm. When the Commonwealth Games Federation announced that the city would host the 2030 edition, nobody expected prices to react this quickly. But here we are in 2026, watching property values climb in areas that were barely on anyone's radar just two years ago.
Let me break down what's actually happening on the ground, backed by real numbers and data from credible sources.
According to Knight Frank India's latest report, Ahmedabad recorded 18,752 residential unit sales in 2025, marking a modest 3% growth year over year. (Source: Times of India, January 2026)
But here's where it gets interesting. Q1 2026 data from Adani Realty shows housing demand jumped 21.4% with average prices climbing 1.4%. That might not sound like much, but when you dig into specific localities near the commonwealth games ahmedabad venue sites, the story changes completely.
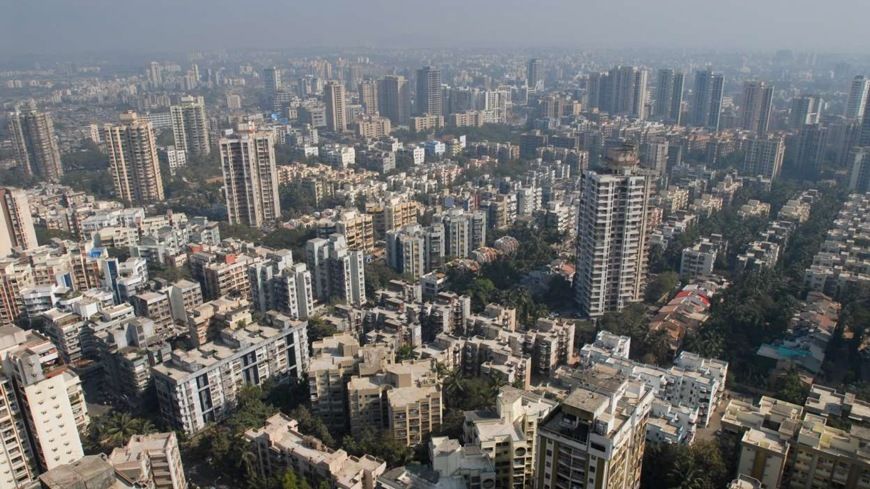
Source: Knight Frank India Report, January 2026
The unsold inventory sitting at 36,231 units with a quarters to sell ratio of 7.6 means the market has less than two years of supply at current sales rates. That's actually healthy. Not too hot, not too cold.
Property Prices in Ahmedabad Area Wise: The Real Picture Forget the generic averages. Let me show you what properties actually cost in different parts of the city right now.
| Area | Average Price (₹/sq ft) | Price Range (₹/sq ft) | Growth Potential |
|---|---|---|---|
| Gota | 5,672 | 2,500 – 11,391 | High |
| Bopal | 6,360 | 4,500 – 8,200 | High |
| South Bopal | 7,487 | 6,000 – 9,500 | Very High |
| Shela | 5,490 – 6,686 | 4,800 – 7,200 | Moderate |
| Chandkheda | 4,923 | 3,800 – 6,500 | Very High |
| Satellite | 9,500 – 12,000 | 8,000 – 14,000 | Moderate |
| Prahlad Nagar | 10,200 – 13,500 | 8,500 – 15,000 | Moderate |
Source: Pardha Greenscapes Market Analysis 2026
Notice something? The areas near the Metro Phase 2 corridor and commonwealth games ahmedabad 2030 venue locations are showing the widest price ranges. That's speculation creeping in, but it's based on real infrastructure development.
The government announced a 131% budget increase for sports infrastructure in 2025-26, taking it to ₹3,794 crore. (Source: Economic Times Infrastructure, January 2026)
Two major complexes are coming up:
Athletics stadium Shooting center Training facilities Completion target: 2029
But the real estate action isn't just about these venues. The government is pushing private sector participation for athlete villages, broadcasting centers, and support infrastructure. That means actual commercial development, not just government projects that sit empty after the event.
Delhi 2010 taught everyone a lesson. Costs ballooned from ₹1,200 crore to ₹18,500 crore because of poor planning. Ahmedabad is trying to avoid that by involving private developers from day one.
Here's what's actually moving the needle on property prices:
The 28.25 km extension is now fully operational. The Motera to Gandhinagar Sector-1 stretch (15.4 km) and the GNLU to GIFT City spur (5.416 km) opened in late 2024. The final Gandhinagar Sector-1 to Mahatma Mandir section (7.45 km) just became operational.
Expected price impact in Motera and Chandkheda: 15% over next 18 months
Source: Gujarat Metro Rail Corporation, The Metro Rail Guy Analysis
GIFT City isn't just a financial district anymore. With direct metro connectivity and the commonwealth games pushing infrastructure development, property demand here has exploded.
Expected price impact: +22%
Source: iRealty247 Market Report 2025
The Mumbai-Ahmedabad High Speed Rail corridor is progressing. Land acquisition is nearly complete, and construction is visible.
Expected price impact in western corridor: +18%
Source: iRealty247 Infrastructure Analysis
The outer ring road expansion is opening up areas that were previously too far from the city center.
Impact zones: SG Highway extension, Bopal, Chandkheda
| Segment | Expected Growth | Key Drivers |
|---|---|---|
| Premium (₹1 Cr+) | 8–12% | Commonwealth Games, GIFT City |
| Mid-Segment (₹50L–₹1 Cr) | 10–15% | Metro connectivity, employment hubs |
| Affordable (<₹50L) | 6–8% | Peripheral development, first-time buyers |
| Rental Yields | 3–5% | Employment growth, student housing |
The mid segment is where the action is. In Q2 2026, it accounted for 55% of all launches. The northern corridor (GIFT City, Peripheral North) represented 50% of new projects.
Some people are calling the 10% jump in unsold inventory a crisis. Let me put that in perspective.
36,231 unsold units with a QTS ratio of 7.6 means the market can absorb this inventory in under two years at current sales velocity. That's not a crisis. That's normal market functioning.
What happened is simple: developers launched aggressively in H1 2025 (22,000+ units), but sales didn't keep pace immediately. Now in 2026, absorption is catching up. Q1 demand was up 21.4%.
The real issue isn't oversupply. It's project quality and location. Well-located projects near metro stations and employment hubs are selling fast. Poorly planned projects in disconnected areas are sitting.
Source: Times of India, Knight Frank India, January 2026
Source: Economic Times Infrastructure, January 2026
Based on actual transaction data and developer activity, here's where serious investors are putting money:
Rental yields in Ahmedabad range from 3% to 5% depending on location and property type. That's lower than Pune (4-6%) but better than Mumbai (2-3%).
| Location | Typical Rent (2 BHK) | Property Value | Annual Yield |
|---|---|---|---|
| Satellite | ₹18,000–25,000 | ₹75–90 lakhs | 2.8–3.5% |
| Prahlad Nagar | ₹20,000–28,000 | ₹80–1 crore | 3.0–3.6% |
| Bopal | ₹15,000–22,000 | ₹55–75 lakhs | 3.5–4.2% |
| Gota | ₹14,000–20,000 | ₹45–65 lakhs | 3.8–4.5% |
| Chandkheda | ₹12,000–18,000 | ₹40–55 lakhs | 4.0–4.8% |
Rentals grew 6% year over year in 2025, with North and East submarkets leading. That's actual income growth, not just capital appreciation on paper.
The product mix tells you where the market is heading.
Source: Knight Frank India Report
The shift toward premium is real. Developers are betting that Commonwealth Games will bring global attention and affluent buyers. Projects with smart home features, gated communities, and sustainable design are getting premium pricing.
NRIs accounted for approximately 12-15% of property purchases in Ahmedabad in 2025. That's up from 8-10% in 2023.
Preferred property types: 3BHK apartments in gated communities with professional management
Here's when major projects complete and expected price reactions:
Metro Phase 2 full operation (Q1) ✓ Completed Ring Road expansion (Q3-Q4) Impact: Chandkheda +8-10%, Motera +10-12%
Let's be honest about what could go wrong:
Developers are launching projects everywhere. Not all locations will appreciate equally. Poorly connected areas will struggle.
If RBI raises rates, the ₹50 lakh to ₹1 crore segment (50% of market) will feel it immediately.
If costs balloon like Delhi 2010, public sentiment could turn negative, affecting market psychology.
If GIFT City doesn't attract enough companies, the surrounding real estate boom could fizzle.
As prices rise faster than rents, yields could drop below 3%, making investment less attractive.
Based on current data, here's what makes sense:
Buy now in established areas (Satellite, Prahlad Nagar, Bopal) if you need a home. Prices will only go up, and waiting means paying more.
Focus on Chandkheda, Motera, Gota. Metro connectivity and Commonwealth Games proximity offer 12-15% annual appreciation potential through 2028.
Target mid-segment 2BHK/3BHK in Bopal, Gota, Chandkheda. Yields of 4-4.5% plus capital appreciation of 8-10% give total returns of 12-14%.
Stick to established developers in South Bopal and Prahlad Nagar. Pay the premium for professional management and RERA-compliant projects.
The Ahmedabad real estate market 2026 is at an inflection point. Commonwealth Games infrastructure, Metro Phase 2 completion, GIFT City expansion, and the bullet train project are creating genuine value, not just hype.
Prices are rising, but from a low base. At ₹3,120/sq ft average (Knight Frank data), Ahmedabad remains India's most affordable major city. Even premium areas at ₹10,000-13,000/sq ft are cheaper than equivalent locations in Mumbai, Bangalore, or even Pune.
The 21.4% demand jump in Q1 2026 suggests buyers recognize the opportunity. The question isn't whether to invest in Ahmedabad real estate. The question is where and when.
Based on current data, the answer is: well-connected areas near metro stations and employment hubs, and the time is now, before Commonwealth Games construction activity pushes prices further.
According to Knight Frank India's latest report, the average property price in Ahmedabad is ₹3,120 per square foot as of H2 2025, with a 3% year over year increase. However, prices vary significantly by location. Gota averages ₹5,672/sq ft, Bopal is at ₹6,360/sq ft, while premium areas like Satellite and Prahlad Nagar range from ₹9,500 to ₹13,500/sq ft. (Source: Knight Frank India)
Infrastructure development for the Commonwealth Games is already impacting prices. Areas near the Sardar Vallabhbhai Patel Sports Enclave and Gujarat Police Academy Sports Hub are seeing increased investor interest. The government allocated ₹3,794 crore (131% budget increase) for sports infrastructure in 2025-26. Analysts project 12-15% price appreciation in venue proximity areas by 2029, with citywide visibility boost adding another 10-15% premium segment growth post-Games. (Source: Economic Times Infrastructure, Vital Space Real Estate Analysis)
Based on infrastructure development and price data, Chandkheda/Motera (current ₹4,923/sq ft, Metro Phase 2 connectivity, 15% projected growth), South Bopal (₹7,487/sq ft, strong NRI demand, established infrastructure), Gota (₹5,672/sq ft, SG Highway access, mid-segment demand), and GIFT City periphery (₹6,500-8,000/sq ft, employment hub, 22% projected growth) offer the strongest investment potential through 2028. (Source: iRealty247, Adani Realty Market Report)
No. While unsold inventory increased 10% to 36,231 units in H2 2025, the Quarters to Sell ratio of 7.6 indicates less than two years of supply at current sales rates, which is healthy market functioning. Q1 2026 showed 21.4% demand growth, suggesting absorption is accelerating. The issue is location-specific, with well-connected projects near metro and employment hubs selling faster than poorly located developments. (Source: Knight Frank India, Times of India)
Rental yields range from 3% to 5% depending on location. Chandkheda offers 4.0-4.8%, Gota provides 3.8-4.5%, Bopal yields 3.5-4.2%, while premium areas like Satellite and Prahlad Nagar offer 2.8-3.6%. Rentals grew 6% year over year in 2025, with North and East submarkets leading growth. Mid-segment 2BHK/3BHK apartments in well-connected areas offer the best rental returns. (Source: Market Survey 2026)
Metro Phase 2 (28.25 km extension) became fully operational in Q1 2026, connecting Motera, Gandhinagar, and GIFT City. Areas along the corridor are experiencing 15% projected price impact over 18 months. Motera and Chandkheda are primary beneficiaries due to improved connectivity to Ahmedabad core and GIFT City employment hub. Stations like Infocity, Sector-1, and Koba Circle are seeing rising property values. (Source: Gujarat Metro Rail Corporation, The Metro Rail Guy)
In Bopal, 2BHK apartments range from ₹35-50 lakhs while 3BHK units cost ₹55-75 lakhs. In Satellite, 2BHK properties are priced at ₹60-80 lakhs and 3BHK at ₹90 lakhs to ₹1.2 crore. Gota offers 2BHK at ₹30-45 lakhs and 3BHK at ₹45-65 lakhs. The ₹50 lakh to ₹1 crore segment dominated 2025 with 46% of sales and 50% of launches, indicating strong mid-segment demand. (Source: Knight Frank India)
Yes, NRI investment increased to 12-15% of total purchases in 2025, up from 8-10% in 2023. Key drivers include RERA transparency in Gujarat, cultural connection with Gujarati diaspora, affordability compared to Mumbai/Bangalore, rental income potential of 3-5%, and Commonwealth Games creating global visibility. Preferred areas are South Bopal, Prahlad Nagar, and Satellite, with focus on 3BHK apartments in gated communities with professional management. (Source: Market Analysis, Developer Reports)
Metro Phase 2 (fully operational Q1 2026, 15% price impact in Motera/Chandkheda), GIFT City expansion (22% projected growth), Mumbai-Ahmedabad Bullet Train (2027 completion, 18% western corridor impact), Ring Road upgrades (opening peripheral areas), and Commonwealth Games venues (Sardar Vallabhbhai Patel Sports Enclave, Gujarat Police Academy Sports Hub, completion 2029) are the primary infrastructure drivers. (Source: iRealty247, Gujarat Metro Rail Corporation, Economic Times)
Current data suggests buying now in well-connected areas. Q1 2026 showed 21.4% demand growth with 1.4% price increase, indicating upward momentum. Metro Phase 2 is operational, Commonwealth Games infrastructure development is accelerating, and GIFT City expansion is progressing. At ₹3,120/sq ft average, Ahmedabad remains India's most affordable major city. Waiting could mean paying 10-15% more by 2027-2028 as infrastructure projects complete. Focus on established areas or metro-connected locations for best value. (Source: Adani Realty, Knight Frank India)
Contact Us
Fill out this form
& we'll get back
to you
Recommended for you