Market Trends

Cost of Buying a House in Mumbai – Area wise per sq ft
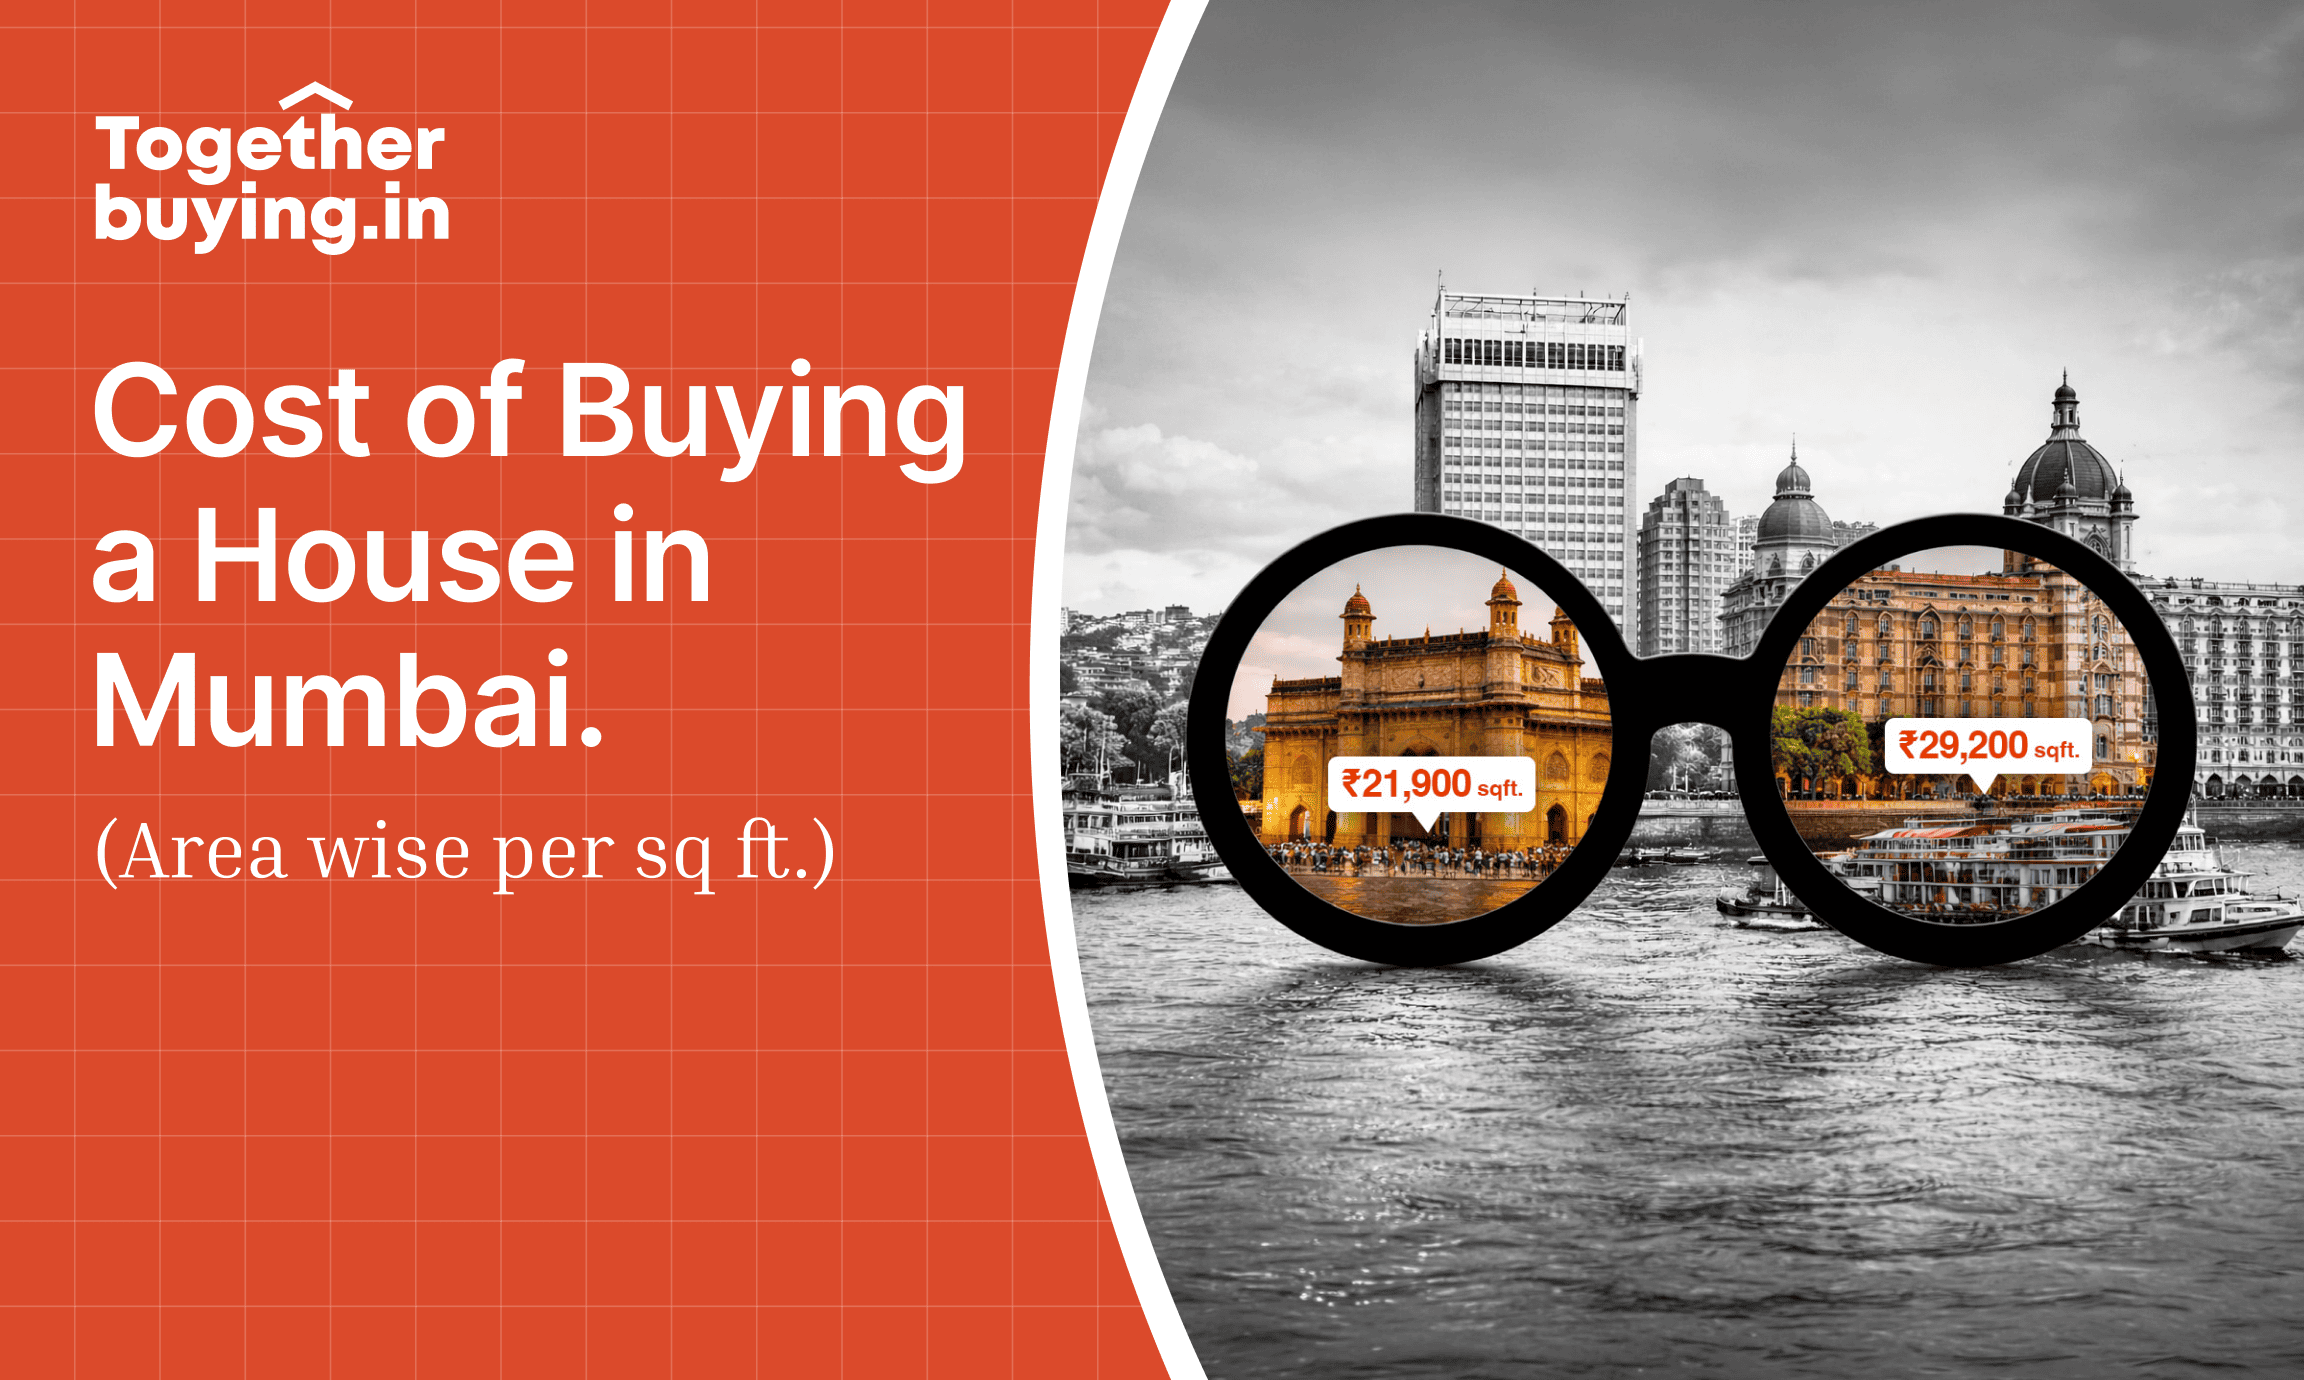
Cost of Buying a House in Mumbai – Area wise per sq ft

03 Mar 2026

Content

No Blogs content found

It looks like there haven’t been any blogs yet!

Get answer to all your queries

We're here to help

Talk to Expert

Mumbai contains many separate property markets. Price per square foot varies widely across those markets. The same budget in Mumbai will buy very different areas of carpet area depending on location.

This article shows area level saleable rates you provided, converts those rates to carpet basis, and places those numbers in the context of market absorption and recent transaction trends. It also explains taxes and total cash outflow, negotiation levers, and a due diligence checklist.

Key market facts at a glance

  • City level average asking price rose substantially between 2023 and 2025 according to portal aggregates.
  • Sales volume across top cities fell in 2025 while unsold stock rose slightly, reflecting a recalibration of demand and supply.
  • Mumbai recorded a strong registration year in 2025 with over 150,000 property registrations in the municipal area.
  • Q3 2025 and related quarterly reports show that premium and ready to move inventory drove much of the demand in Mumbai.

Use these facts with the area table below. All area prices you gave are treated as saleable basis unless stated.

Area level saleable price table and carpet conversion

Input rates are saleable per square foot as provided by you. Conversion assumes carpet efficiency seventy five percent unless you give a different efficiency for an area. Carpet rate equals saleable rate divided by 0.75.

AreaSaleable Rate (₹/sq ft)Carpet Rate (₹/sq ft)
Malabar Hill1,17,7251,56,966
Worli1,02,1691,36,225
Bandra West88,4221,17,896
Juhu83,2381,10,984
Lower Parel66,25188,335
Khar51,69768,929
Dadar39,00752,010
Powai35,64347,524
Kurla18,74524,993
Dharavi17,00022,667

How to read the table

  • Saleable rate is the price commonly quoted in project price lists and portals.
  • Carpet rate is the usable area based price that RERA uses for disclosure. Use carpet rate to compare projects if you want the price per usable square foot.
  • If a developer quotes price on carpet basis you do not need to convert.

Now we review each area and place the price in a short practical context with worked numbers that buyers can use.

Malabar Hill — ₹1,17,725 saleable | ₹1,56,966 carpet

Numbers

  • Saleable rate ₹1,17,725 per sq ft.
  • Carpet rate at 75 percent efficiency ₹1,56,966 per sq ft.
  • Example: 1,500 sq ft saleable unit costs 1,500 × 1,17,725 = ₹17,65,87,500.

Why this matters

Malabar Hill shows the upper end of Mumbai pricing. Transactions occur at high absolute ticket sizes. Buyers in this market often treat property as long term capital allocation. Volume of transactions is low compared with other parts of the city.

What to check

  • Verify freehold title and building age.
  • Confirm recent sale deed comparables for the specific building and floor.
  • Expect additional charges including parking and membership fees.

Worli — ₹1,02,169 saleable | ₹1,36,225 carpet

Numbers

  • Saleable rate ₹1,02,169 per sq ft.
  • Carpet rate ₹1,36,225 per sq ft.
  • Example: 1,500 sq ft saleable unit costs 1,500 × 1,02,169 = ₹15,32,53,500.

Why this matters

Worli supply includes high rise towers. Buyers here trade on modern layouts and amenities while remaining inside city limits.

What to check

  • Confirm developer credentials for large towers.
  • Inspect recent transaction records in the same tower or adjacent towers.

Bandra West — ₹88,422 saleable | ₹1,17,896 carpet

Numbers

  • Saleable rate ₹88,422 per sq ft.
  • Carpet rate ₹1,17,896 per sq ft.
  • Example: 1,200 sq ft saleable unit costs ₹10,61,06,400.

Why this matters

Bandra West has resale liquidity. Buyers choose Bandra for location and transport nodes.

What to check

  • Parking entitlement clarity.
  • Service charges and maintenance corpus.

Juhu — ₹83,238 saleable | ₹1,10,984 carpet

Numbers

  • Saleable rate ₹83,238 per sq ft.
  • Carpet rate ₹1,10,984 per sq ft.
  • Example: 1,200 sq ft saleable unit costs ₹9,98,85,600.

Why this matters

Juhu shows beachfront premium within western suburbs. Track supply of low rise plots and bungalow conversions.

What to check

  • Flooding risk and municipal drainage records for the plot.
  • Boundaries and surplus land rights.

Lower Parel — ₹66,251 saleable | ₹88,335 carpet

Numbers

  • Saleable rate ₹66,251 per sq ft.
  • Carpet rate ₹88,335 per sq ft.
  • Example: 1,200 sq ft saleable unit costs ₹7,95,01,200.

Why this matters

Lower Parel reflects mill land conversion. Many towers command large units.

What to check

  • Construction quality and floor plate design.
  • Builder track record on similar mill conversion projects.

Khar — ₹51,697 saleable | ₹68,929 carpet

Numbers

  • Saleable rate ₹51,697 per sq ft.
  • Carpet rate ₹68,929 per sq ft.
  • Example: 1,200 sq ft saleable unit costs ₹6,20,36,400.

Why this matters

Khar sits between Bandra and Santacruz. It shows moderate premium relative to central western suburbs.

What to check

  • Road access at different times of day.
  • Redevelopment proposals in the block.

Dadar — ₹39,007 saleable | ₹52,010 carpet

Numbers

  • Saleable rate ₹39,007 per sq ft.
  • Carpet rate ₹52,010 per sq ft.
  • Example: 1,000 sq ft saleable unit costs ₹3,90,07,000.

Why this matters

Dadar sits at the junction of island city and central suburbs. It is a workhorse location for middle segment buyers.

What to check

  • Building plan permissions and occupancy certificates.
  • Share of older stock and redevelopment risk.

Powai — ₹35,643 saleable | ₹47,524 carpet

Numbers

  • Saleable rate ₹35,643 per sq ft.
  • Carpet rate ₹47,524 per sq ft.
  • Example: 1,000 sq ft saleable unit costs ₹3,56,43,000.

Why this matters

Powai has planned township complexes with consistent layouts. It is a location preferred by salaried professionals working in nearby tech parks.

What to check

  • RERA registration for the tower.
  • Proportion of open space and parking rules.

Kurla — ₹18,745 saleable | ₹24,993 carpet

Numbers

  • Saleable rate ₹18,745 per sq ft.
  • Carpet rate ₹24,993 per sq ft.
  • Example: 1,000 sq ft saleable unit costs ₹1,87,45,000.

Why this matters

Kurla remains lower priced while connectivity upgrades are in progress. It is an area for buyers who prioritise space over central location.

What to check

  • Impact of adjacent industrial activity on quality of life.
  • Exact address relation to transit nodes.

Dharavi — ₹17,000 saleable | ₹22,667 carpet

Numbers

  • Saleable rate ₹17,000 per sq ft.
  • Carpet rate ₹22,667 per sq ft.
  • Example: 800 sq ft saleable unit costs ₹1,36,00,000.

Why this matters

Dharavi shows potential change if large scale redevelopment occurs. Timing and legal clarity determine returns.

What to check

  • Status of approved redevelopment schemes.
  • Compensation and allotment terms for existing occupants.

Market absorption and sales context

Sales and absorption numbers changed in 2025. National and Mumbai specific data show two trends.

First, sales volume across top cities fell in 2025 compared with 2024. Analysts attribute the fall to normalization after earlier high activity and to the shift from speculative demand to end user demand. This trend affected new launches and absorption.

Second, portals and market trackers show average city level price rise and a shift in demand toward ready to move and premium units. MagicBricks data records a rise in average price per sq ft between 2023 and 2025 across Mumbai listings. Portal reports indicate price consolidation in 2025 while premium activity remained active.

Local registration data for 2025 shows a high number of property registrations in Greater Mumbai. Over 150,000 property registrations were recorded in 2025 municipal records. That count points to real transaction momentum despite the national volume slowdown for launches.

How to read absorption for a buyer

When absorption is high in a locality developers reduce incentives and restrict discounting.

When unsold inventory rises developers may offer concessions. Anarock and PropTiger reports show unsold stock rose across top cities in 2025, though Mumbai had pockets of strong movement for ready to move inventory.

If you are buyer who needs quick possession and low incentive risk buy ready to move units in nodes with consistent registration activity. If you target capital gain look at nodes with rising infrastructure projects and limited fresh supply.

From per sq ft to final cash required

Step by step budget for purchase

  • Compute base property price: saleable rate × saleable area.
  • Add stamp duty and registration. Maharashtra rates change over time. Use current government schedule for exact calculation. As example use a combined stamp and registration percent of 6 to 7 percent for estimation.
  • Add GST if the property is under construction and not RERA registered for sale. Consult finance advisor for project specific GST rules.
  • Add parking charges if not included.
  • Add preferential location charges if any.
  • Add legal fees and loan processing fees.
  • Add fit out and interior cost.

Worked example with Powai numbers

  • Saleable rate ₹35,643 per sq ft. For a 1,000 sq ft saleable unit base price = ₹35,643,000.
  • Stamp and registration at 6.25 percent = ₹2,227,687.
  • Other charges and buffer say 8 percent = ₹2,851,440.
  • Total estimated outflow = ₹40,722,127.

Adjust percentages as per exact project terms.

Negotiation levers that work in Mumbai now

Use supply and absorption signals. Based on 2025 reports the following levers matter:

Price negotiating leverage

Project age and inventory. Ready to move inventory sees smaller price moves but more freebies such as free parking for limited time. Under construction projects may allow payment plan changes.

Timing

Developer quarter end and project completion dates can unlock concessions. Use recent registration activity as a signal for market appetite.

Comparable sale deeds

Access to recent sale deed price for the same tower or street strengthens negotiation. Registrations in 2025 show where transactions actually occurred.

Non price concessions

  • Waiver of corpus fund contribution for a period.
  • Stamp duty share by developer in rare cases.
  • Free upgrades for modular kitchen or cladding.

Documentation requirements

Confirm RERA registration. Projects without RERA may restrict loan options. Use PropTiger and Anarock insight sections to read market level approvals.

Due diligence checklist before you sign

Mandatory checks

  • Title and encumbrance certificate for resale units.
  • RERA registration and complaint history.
  • Completion certificate and occupancy certificate for ready to move units.
  • Approved building plan and sanctioned layout for plot based properties.
  • Verify saleable area definition in sale agreement. Confirm whether price is saleable or carpet.
  • Confirm parking entitlement and document.
  • Check corpus fund amount and monthly maintenance estimate.

Technical checks

  • Structural inspection for older buildings.
  • Water proofing history for top floors.
  • Drainage and sewage line mapping.

Finance checks

  • Confirm tax treatment for stamp duty and GST.
  • Verify loan pre approval limits and LTV ratio applied to the project.
  • Check developer bank and escrow account details.

Legal checks

  • Any litigation on title or project.
  • Clarify force majeure clauses and completion timelines.

Where to buy based on objective

Capital preservation

Choose locations with constrained land such as Malabar Hill and Worli. These areas show long term value retention. Transaction volume will be low but supply will remain constrained.

City access and lifestyle

Lower Parel, Bandra West, Juhu. These areas combine location and amenities while maintaining resale potential.

Balance of space and cost

Powai and Dadar offer moderate rates with consistent demand from working households.

Entry level Mumbai inside city limit

Kurla and Dharavi will buy more carpet area and can be suitable for households that prioritise space over commute time.

Market signals to watch in 2026

  • Registration momentum. City registration counts in 2025 were high. If registrations keep rising it signals continued transaction demand.
  • Unsold inventory and new launches. Rising unsold inventory could pressure prices in peripheral nodes. Anarock reported unsold inventory rose across top cities in 2025.
  • Infrastructure delivery. Metro extensions and road projects change catchment and effective commute time. Portals showed demand rise in nodes with new infrastructure.
  • Lending rates. Changes in home loan rates will change buyer affordability and impact absorption speed.

Frequently asked questions

Q. Should I compare carpet rates or saleable rates?

A. Compare carpet rates to measure usable area value. Saleable rates are useful for developer price lists but saleable to carpet conversion must be done to compare usable floor space.

Q. How much buffer should I add to base price for final outflow?

A. Add at least 12 percent for stamp duty registration and minimal other charges. For under construction projects add GST and parking charges which can push the buffer to 18 percent.

Q. Are portal averages reliable?

A. Portals show asking and reported transaction averages. Use them as anchors but verify recent sale deeds for a specific tower.

Q. Does Mumbai still show growth?

A. Price growth moderated across top cities in 2025. Mumbai showed consolidation with pockets of demand for ready to move and premium units. Use registration and absorption signals to time purchases.


Share with

Contact Us

Fill out this form
& we'll get back
to you

Afghanistan
+93
Albania
+355
Algeria
+213
Andorra
+376
Angola
+244
Antigua and Barbuda
+1268
Argentina
+54
Armenia
+374
Aruba
+297
Australia
+61
Austria
+43
Azerbaijan
+994
Bahamas
+1242
Bahrain
+973
Bangladesh
+880
Barbados
+1246
Belarus
+375
Belgium
+32
Belize
+501
Benin
+229
Bhutan
+975
Bolivia
+591
Bosnia and Herzegovina
+387
Botswana
+267
Brazil
+55
British Indian Ocean Territory
+246
Brunei
+673
Bulgaria
+359
Burkina Faso
+226
Burundi
+257
Cambodia
+855
Cameroon
+237
Canada
+1
Cape Verde
+238
Caribbean Netherlands
+599
Cayman Islands
+1
Central African Republic
+236
Chad
+235
Chile
+56
China
+86
Colombia
+57
Comoros
+269
Congo
+243
Congo
+242
Costa Rica
+506
Côte d'Ivoire
+225
Croatia
+385
Cuba
+53
Curaçao
+599
Cyprus
+357
Czech Republic
+420
Denmark
+45
Djibouti
+253
Dominica
+1767
Dominican Republic
+1
Ecuador
+593
Egypt
+20
El Salvador
+503
Equatorial Guinea
+240
Eritrea
+291
Estonia
+372
Ethiopia
+251
Faroe Islands
+298
Fiji
+679
Finland
+358
France
+33
French Guiana
+594
French Polynesia
+689
Gabon
+241
Gambia
+220
Georgia
+995
Germany
+49
Ghana
+233
Greece
+30
Greenland
+299
Grenada
+1473
Guadeloupe
+590
Guam
+1671
Guatemala
+502
Guinea
+224
Guinea-Bissau
+245
Guyana
+592
Haiti
+509
Honduras
+504
Hong Kong
+852
Hungary
+36
Iceland
+354
India
+91
Indonesia
+62
Iran
+98
Iraq
+964
Ireland
+353
Israel
+972
Italy
+39
Jamaica
+1876
Japan
+81
Jordan
+962
Kazakhstan
+7
Kenya
+254
Kiribati
+686
Kosovo
+383
Kuwait
+965
Kyrgyzstan
+996
Laos
+856
Latvia
+371
Lebanon
+961
Lesotho
+266
Liberia
+231
Libya
+218
Liechtenstein
+423
Lithuania
+370
Luxembourg
+352
Macau
+853
Macedonia
+389
Madagascar
+261
Malawi
+265
Malaysia
+60
Maldives
+960
Mali
+223
Malta
+356
Marshall Islands
+692
Martinique
+596
Mauritania
+222
Mauritius
+230
Mayotte
+262
Mexico
+52
Micronesia
+691
Moldova
+373
Monaco
+377
Mongolia
+976
Montenegro
+382
Morocco
+212
Mozambique
+258
Myanmar
+95
Namibia
+264
Nauru
+674
Nepal
+977
Netherlands
+31
New Caledonia
+687
New Zealand
+64
Nicaragua
+505
Niger
+227
Nigeria
+234
North Korea
+850
Norway
+47
Oman
+968
Pakistan
+92
Palau
+680
Palestine
+970
Panama
+507
Papua New Guinea
+675
Paraguay
+595
Peru
+51
Philippines
+63
Poland
+48
Portugal
+351
Puerto Rico
+1
Qatar
+974
Réunion
+262
Romania
+40
Russia
+7
Rwanda
+250
Saint Kitts and Nevis
+1869
Saint Lucia
+1758
Saint Pierre & Miquelon
+508
Saint Vincent and the Grenadines
+1784
Samoa
+685
San Marino
+378
São Tomé and Príncipe
+239
Saudi Arabia
+966
Senegal
+221
Serbia
+381
Seychelles
+248
Sierra Leone
+232
Singapore
+65
Slovakia
+421
Slovenia
+386
Solomon Islands
+677
Somalia
+252
South Africa
+27
South Korea
+82
South Sudan
+211
Spain
+34
Sri Lanka
+94
Sudan
+249
Suriname
+597
Swaziland
+268
Sweden
+46
Switzerland
+41
Syria
+963
Taiwan
+886
Tajikistan
+992
Tanzania
+255
Thailand
+66
Timor-Leste
+670
Togo
+228
Tonga
+676
Trinidad and Tobago
+1868
Tunisia
+216
Turkey
+90
Turkmenistan
+993
Tuvalu
+688
Uganda
+256
Ukraine
+380
United Arab Emirates
+971
United Kingdom
+44
United States
+1
Uruguay
+598
Uzbekistan
+998
Vanuatu
+678
Vatican City
+39
Venezuela
+58
Vietnam
+84
Wallis & Futuna
+681
Yemen
+967
Zambia
+260
Zimbabwe
+263