Market Trends
Top Emerging Tier 2 Cities to Watch for Real Estate Growth in 2026

02 May 2026
Market Trends
02 May 2026
Content
No Blogs content found
It looks like there haven’t been any blogs yet!
India's real estate landscape is experiencing a fundamental shift. While metropolitan giants like Mumbai and Delhi continue to dominate headlines, a new growth story is unfolding in Tier 2 cities across the country. These emerging urban centers are attracting investors, homebuyers, and businesses with their compelling combination of affordability, infrastructure development, and strong economic fundamentals.
KPMG reports that Tier 2 and Tier 3 cities drove 66% of new direct-to-consumer orders in FY2026, signaling a clear economic shift beyond metros. This transformation is backed by substantial government investment, with the ₹1 lakh crore Urban Challenge Fund aimed at unlocking nearly ₹4 lakh crore of investments in these emerging markets.
The migration toward Tier 2 cities is driven by multiple converging factors that make them attractive for real estate investment. Property prices in these markets remain significantly lower than metro cities, while infrastructure development accelerates at an unprecedented pace.
Times of India identifies seven key factors driving this growth: better infrastructure and connectivity, lower property prices and cost of living, expanding job markets, government policy support, improved quality of life, rising disposable incomes, and strategic geographic positioning.
The affordability advantage is substantial. While metro cities see rental yields compressed to 2-3%, Aaj Tak reports that Tier 2 cities are delivering rental yields of 5-7%, making them attractive for income-focused investors.
Indore has emerged as a standout performer, leveraging its status as India's cleanest city to attract both residents and businesses. Times of India highlights the city's strong infrastructure development and upcoming metro project as key growth drivers.

Growth Drivers:
Property Market Trends: The city offers high rental yields and relatively affordable property prices, making it suitable for both investors and homebuyers seeking long-term appreciation.
As Uttar Pradesh's capital, Lucknow benefits from significant government investment and infrastructure development. CNBC TV18 reports that developers like Migsun Group are investing ₹4,000 crore in retail developments across UP cities including Lucknow.

Growth Drivers:
Investment Potential: The city's population of 4.2 million provides a strong rental market, while ongoing infrastructure projects promise capital appreciation.
Nagpur's central location makes it a natural logistics and industrial hub. The city is emerging as a key player in India's manufacturing and distribution networks.
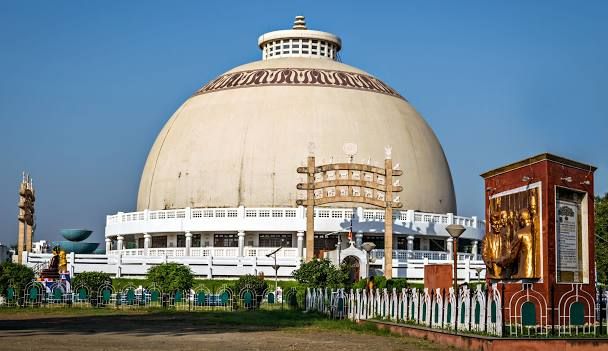
Growth Drivers:
Property Market Trends: Industrial and warehousing demand is driving commercial real estate growth, while residential markets benefit from job creation in logistics and manufacturing.
Coimbatore continues to strengthen its position as a major industrial and educational center in Tamil Nadu, with a population of 3.2 million driving steady real estate demand.

Growth Drivers:
Investment Potential: The city offers balanced growth across residential and commercial segments, with rental demand supported by a diverse economic base.
Bhubaneswar leads the smart city transformation in eastern India. Shuvam Construction projects that land prices in Tier 2 cities like Bhubaneswar could double in 2-4 years.

Growth Drivers:
Property Market Trends: The city shows strong potential for both residential and commercial real estate, with smart infrastructure attracting technology companies and skilled professionals.
Kochi's strategic coastal location and growing IT sector make it a compelling investment destination in southern India.
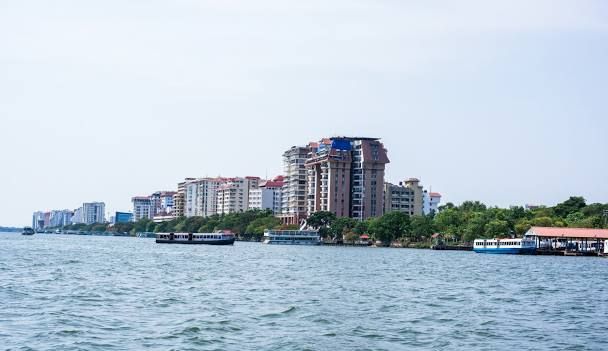
Growth Drivers:
Investment Potential: The city offers diverse economic drivers supporting both rental income and capital appreciation potential.
Jaipur combines historical significance with modern economic development, creating a unique investment proposition.

Growth Drivers:
Property Market Trends: Strong rental demand from tourists, students, and government employees provides stable income potential for investors.
With a population of 9.3 million, Ahmedabad represents one of the largest Tier 2 markets with established industrial and commercial foundations.
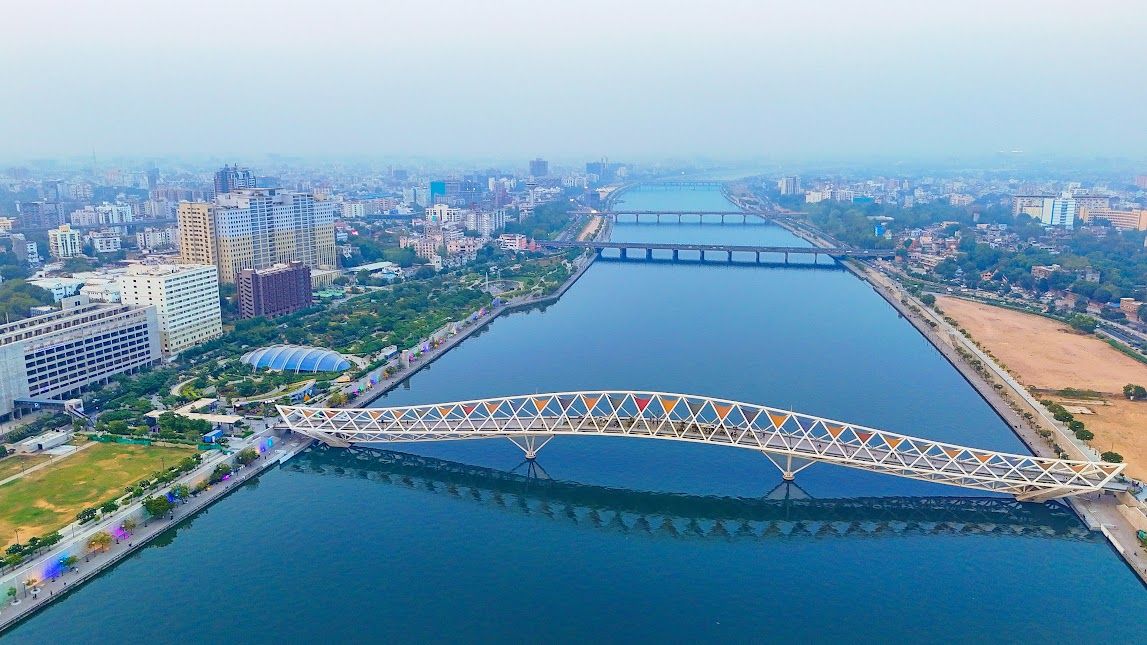
Growth Drivers:
Investment Potential: The city offers mature real estate markets with steady appreciation and rental income potential.
The infrastructure revolution in Tier 2 cities is unprecedented. Fortune India reports that the Ganga Expressway will unlock multi-phase real estate growth across 12 UP districts, with Grade A warehousing expected within 5 km of 18 interchange nodes.
Key Infrastructure Projects:
Business Standard reports that Uttar Pradesh alone is investing over ₹2,900 crore to foster planned urban development in smaller cities, replicating the Smart City Mission for new urban settlements.
The rental yield advantage in Tier 2 cities is compelling. Auro Realty reports that Hyderabad's Hitech City and Kondapur areas are generating rental yields of 5% to 6.5%, more than double the national metro average of 2.5% to 3.5%.
Rental Yield Comparison:
:::cite:New Town Khobor|https://newtownkhobor.in/news/kolkata-new-town-rental-growth-2026-india-metro-comparison/::: reports that Kolkata leads Indian metros with a gross rental yield of 6.32%, demonstrating the income potential in well-positioned Tier 2 markets.
Job creation in Tier 2 cities is accelerating rapidly. Deccan Chronicle reports that Hyderabad and its neighboring districts contributed 98% of Telangana's 3.12 lakh new jobs created in just eight months.
Economic Times notes that Tier 2 cities now make up 30-32% of all new job postings, with hiring demand for tech and Global Capability Center roles picking up noticeably in cities like Mangalore, Ahmedabad, and Nagpur.
The affordability gap between Tier 1 and Tier 2 cities remains substantial, creating opportunities for both end-users and investors. While metro cities see property prices reaching ₹15,000-25,000 per square foot, most Tier 2 cities offer quality properties at ₹3,000-8,000 per square foot.
Price Appreciation Trends:
Successful Tier 2 city investment requires careful evaluation of multiple factors:
Location Analysis:
Infrastructure Pipeline:
Market Fundamentals:
Several trends will continue driving Tier 2 city growth:
Technology Adoption: Data center capacity in Tier 2 and 3 cities is expected to grow four times by 2030, from 82 MW currently, creating new employment and real estate demand.
Government Policy Support: Continued focus on balanced regional development through infrastructure investment and business incentives.
Corporate Expansion: Companies seeking cost optimization and talent diversification are establishing operations in Tier 2 cities.
While Tier 2 cities offer compelling opportunities, investors should consider potential risks:
Market Liquidity: Tier 2 markets may have lower liquidity compared to metros. Mitigation involves focusing on well-connected locations with strong economic fundamentals.
Infrastructure Delays: Project delays can impact appreciation timelines. Investors should diversify across multiple projects and cities.
Market Maturity: Some Tier 2 markets are still developing. Due diligence on local market dynamics and developer track records is essential.
The emergence of Tier 2 cities as real estate investment destinations represents a fundamental shift in India's urban development story. With superior rental yields, affordable entry points, accelerating infrastructure development, and strong job creation, these markets offer compelling opportunities for investors seeking both income and appreciation.
Cities like Indore, Lucknow, Nagpur, Coimbatore, Bhubaneswar, Kochi, Jaipur, and Ahmedabad are leading this transformation, each offering unique advantages based on their economic strengths and infrastructure development. The window for early-stage investment in these markets is narrowing as institutional investors and developers increasingly recognize their potential.
For investors willing to look beyond traditional metro markets, Tier 2 cities in 2026 represent one of the most attractive real estate investment opportunities in India's evolving urban landscape.
Investment requirements vary significantly by city and property type. In most Tier 2 cities, quality residential properties start from ₹25-40 lakhs for 2BHK apartments, while land investments can begin from ₹10-15 lakhs for plots in developing areas. Commercial properties typically require higher investments starting from ₹50 lakhs to ₹1 crore depending on location and size.
Tier 2 cities offer rental yields of 5-7%, significantly higher than current fixed deposit rates of 6-7% and comparable to equity mutual fund returns. The key advantage is that real estate provides both rental income and capital appreciation potential, while also serving as an inflation hedge. However, real estate requires active management and has lower liquidity compared to financial instruments.
Cities with excellent metro connectivity include Jaipur (3 hours to Delhi), Indore (2 hours flight to Mumbai), Coimbatore (1 hour flight to Bangalore), and Lucknow (6 hours to Delhi by road/rail). The upcoming infrastructure projects like expressways and metro rail networks are further improving connectivity. Nagpur's central location makes it equidistant from major metros, while Kochi offers excellent air connectivity to all major cities.
Tax implications are similar to metro city investments. Capital gains tax applies based on holding period: short-term (less than 2 years) taxed as per income slab, long-term (more than 2 years) taxed at 20% with indexation benefits. Rental income is taxed as per income slab after deducting standard deduction of 30% and interest on home loans. Some state governments offer stamp duty reductions for properties in developing areas.
Optimal holding periods vary by city and development stage. For emerging areas with planned infrastructure, 5-7 years allows projects to complete and appreciation to materialize. Established Tier 2 locations may show steady appreciation over 3-5 years. Rental income investors can benefit immediately, while capital appreciation typically accelerates after infrastructure completion. The key is aligning the investment timeline with local development cycles and infrastructure project timelines.
Contact Us
Fill out this form
& we'll get back
to you
Recommended for you


