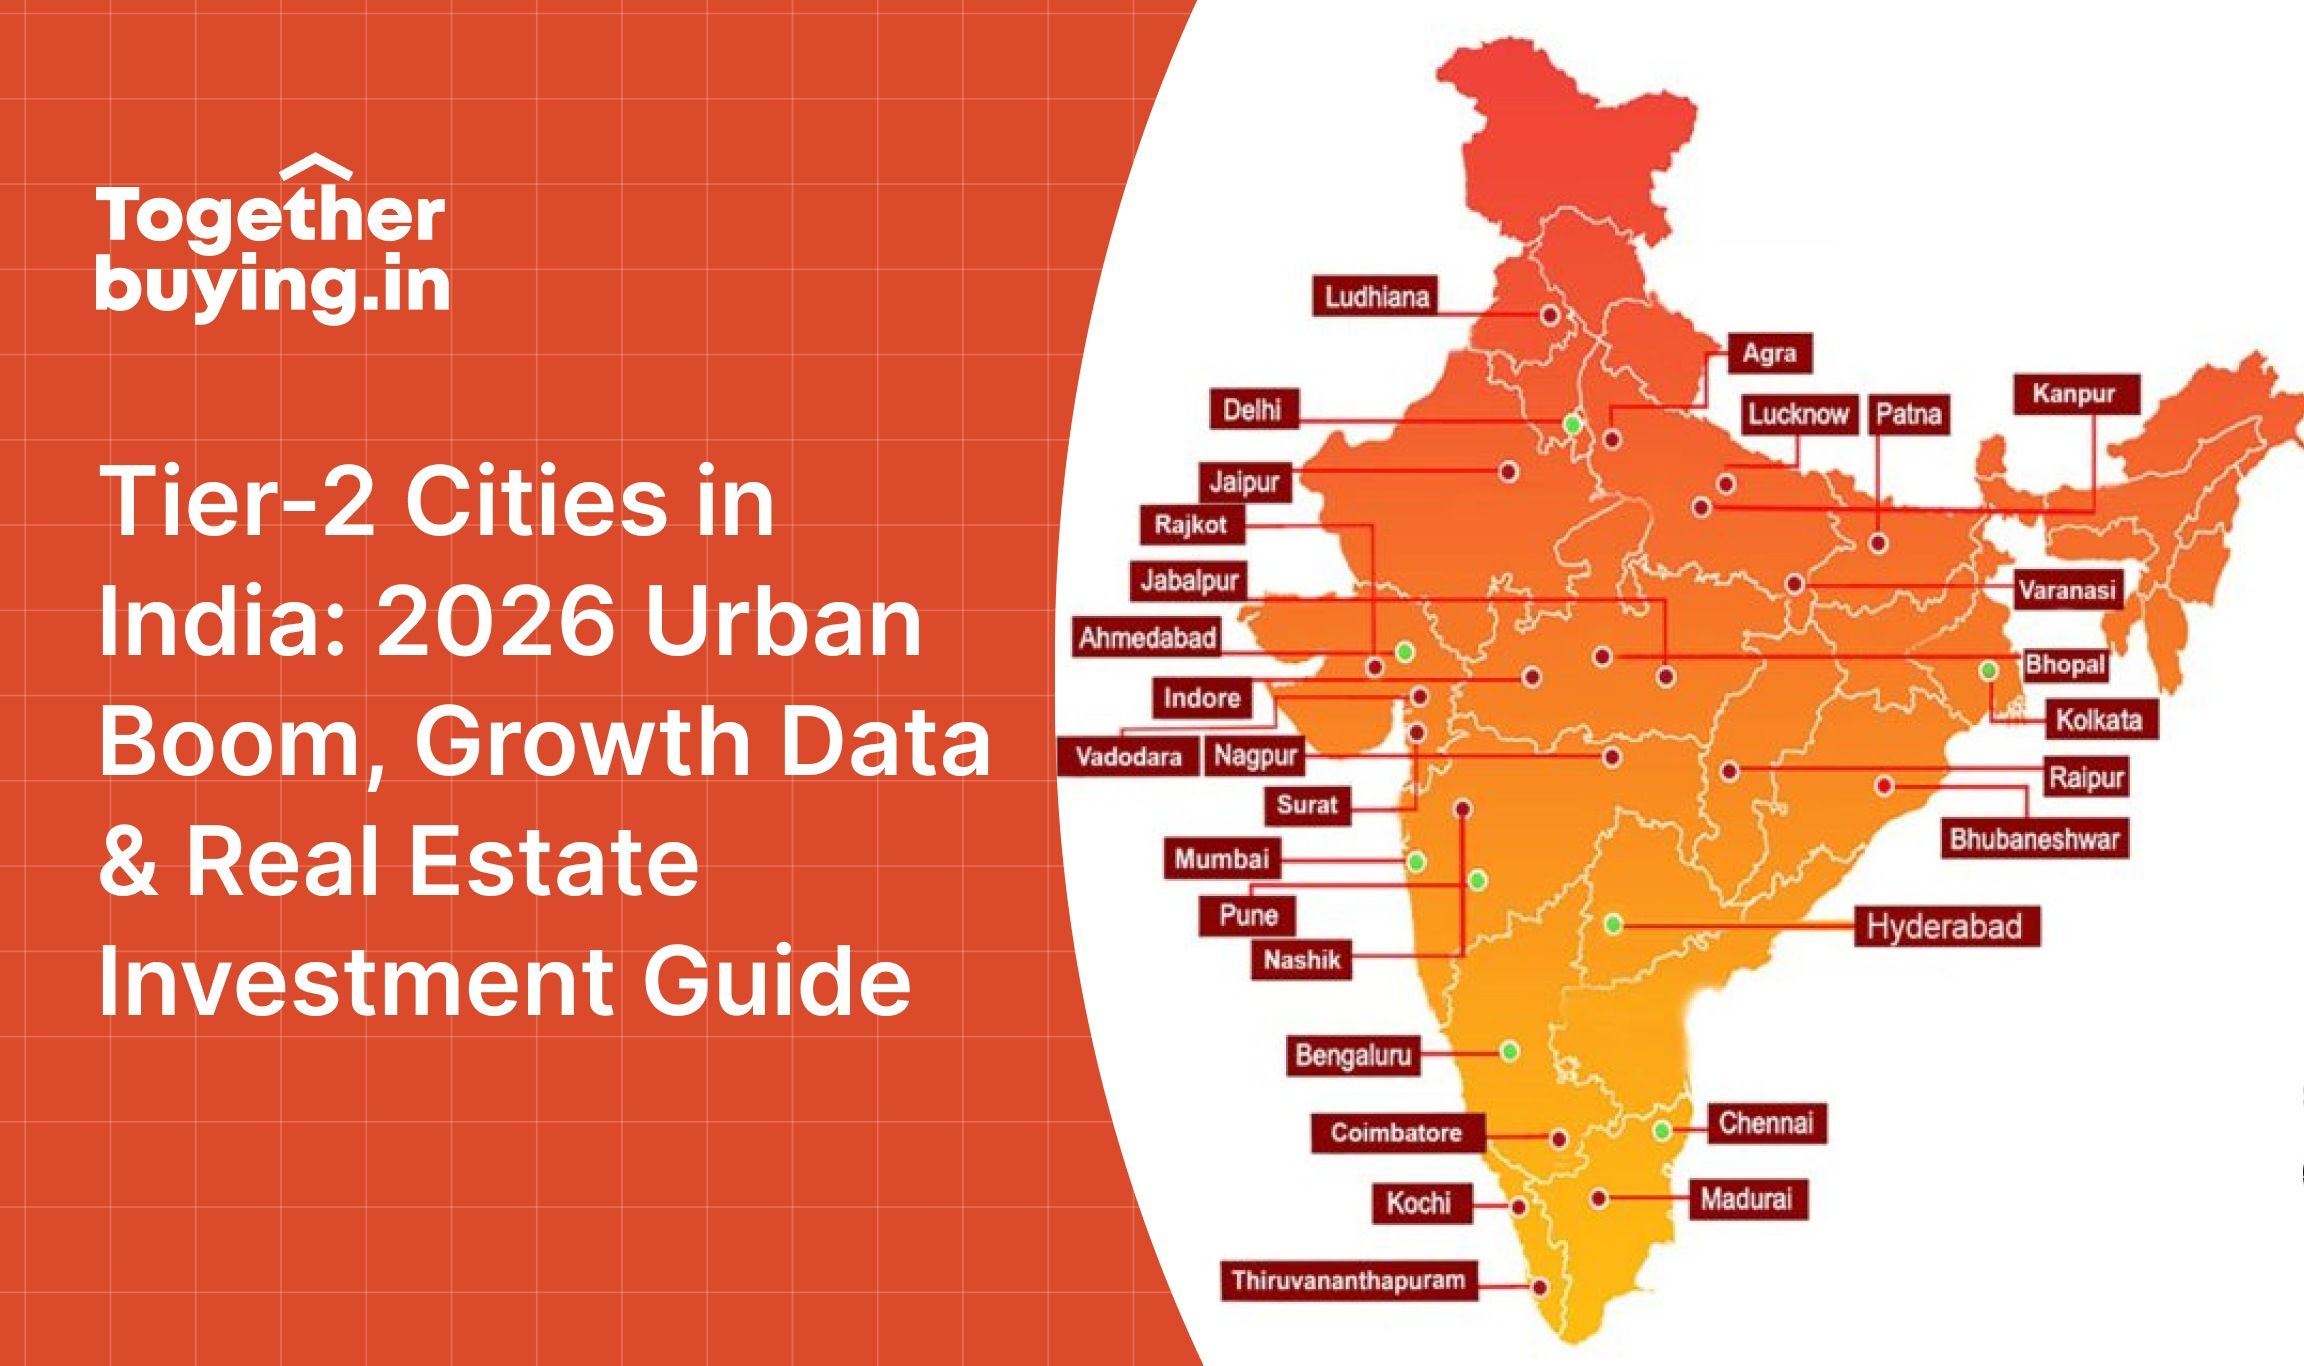
India is witnessing an unprecedented urban transformation in 2026, with tier 2 cities emerging as the new engines of economic growth, innovation, and real estate development. With an urbanization rate projected to reach 37 to 38 percent by 2026, translating to an urban population of approximately 540 to 550 million people, tier 2 cities are no longer secondary options but primary destinations for investment, employment, and quality living.
According to McKinsey projections, 18 tier 2 cities could generate $2 trillion in revenues by 2030, a massive leap from $690 billion in 2023. This article provides a comprehensive analysis of how tier 2 cities are powering India's next urban boom, backed by verified statistics, market data, and investment insights.
Understanding Tier 2 Cities: Definition and Classification
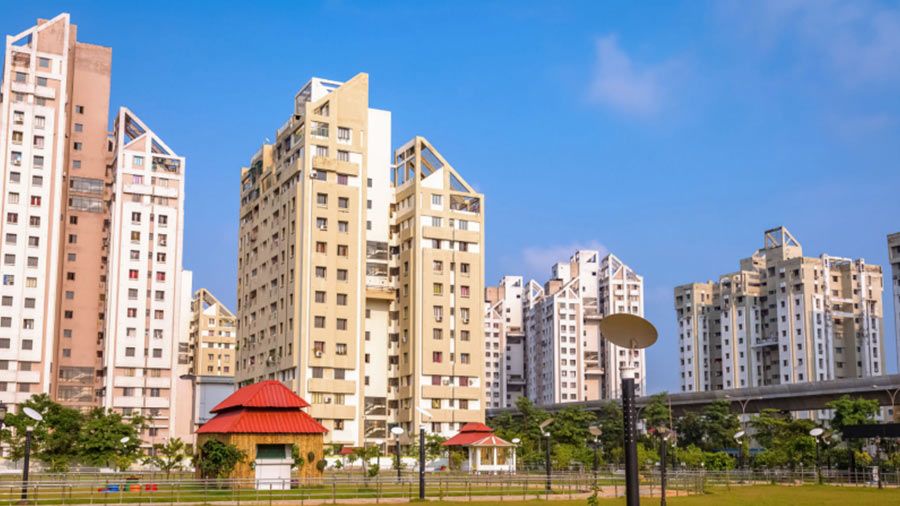
Tier 2 cities in India are typically defined as urban centers with populations between 1 million to 5 million residents. According to the Reserve Bank of India classification, tier 2 cities can also include urban areas with populations between 50,000 to 99,999, depending on the context of economic analysis.
Key Characteristics of Tier 2 Cities
Population Dynamics:
- Population range: 1 million to 5 million
- Housing over 70 percent of India's urban residents
- Expanding faster than megacities
- Projected to add significant urban population by 2050
Economic Profile:
- Lower operational costs compared to tier 1 cities
- Growing GDP contribution
- Emerging as manufacturing and IT hubs
- Attracting FDI and domestic investment
Infrastructure Development:
- Smart Cities Mission beneficiaries
- Metro rail and airport expansions
- Improved road and highway connectivity
- Digital infrastructure growth
- Statistical Overview: Tier 2 Cities by Numbers (2025-2026)
- Urban Growth Statistics
Urbanization Metrics:
- Current Urbanization Rate: 37 to 38 percent (2026)
- Urban Population: 540 to 550 million (2026)
- Tier 2 City Share: Over 70 percent of urban residents
- Projected Growth: Adding over 200 million urban residents by 2050
Economic Contribution:
- Revenue Projection: $2 trillion by 2030 (18 tier 2 cities)
- Current Revenue: $690 billion (2023)
- Growth Rate: Nearly 3x increase in 7 years
- Manufacturing GDP: 16 to 17 percent contribution
- Manufacturing Employment: Over 27 million workers
Real Estate Market Data (2025-2026)
Property Price Trends:
- Average Appreciation: 7.5 percent year on year (Mysuru example)
- Tier 1 Comparison: Tier 2 cities showing higher appreciation than some tier 1 cities
- Price Range: ₹3,800 per sq ft (Mysuru) vs ₹7,500 per sq ft (Bengaluru)
- Affordability Factor: Approximately 50 percent lower than tier 1 cities
Housing Market Performance (Q3 2025):
- Sales Decline: 4 percent year on year in top 15 tier 2 cities
- Sales Value Increase: 4 percent year on year
- New Launches Decline: 10 percent year on year
- Premium Shift: Rising sales value despite lower volumes indicates premium segment growth
Regional Performance:
- Gujarat Cities: Over 60 percent of launches and sales
- Trivandrum: Maximum sales rise at 19 percent (Q3 2025)
- Bhubaneswar: Steepest decline at 26 percent (Q3 2025)
Investment and Business Activity
MSME Distribution:
- Tier 2 and 3 Share: 51 percent of registered MSMEs
- Business Activity Growth: 35 percent increase
- Investor Targeting: 44 percent of investors focusing on tier 2 and 3 cities
Government Investment:
- Smart Cities Allocation: Over ₹1.47 lakh crore
- PLI Scheme Distribution: ₹21,534 crore
- FDI Pledges: $10 billion (Uttar Pradesh investor summits 2025)
Top Tier 2 Cities Driving India's Urban Boom
1. Indore: Central India's Smart City Leader
- Population: 2.5 million
- Area: 276 square kilometers
- Smart City ABD Area: Over 50 acres
Infrastructure Achievements:
- Leading smart city implementation in India
- GIS based project management
- Real time traffic management using data analytics
- Solid waste monitoring systems
- Emergency response infrastructure
IT and Digital Growth:
- New IT park under development
- Super Corridor project (Indore Airport to Vijay Nagar)
- Startup park and convention center approved
- Major tech companies: TCS, Infosys presence
Real Estate Projections:
Property Price CAGR: 8 to 12 percent (2026 to 2030)
Super Corridor Performance: Outperforming peripheral markets
Metro Area Growth: Higher appreciation than city outskirts
Water Infrastructure:
ABD project area receives 13.72 ML water supply
Distribution every alternate day
2. Jaipur: Rajasthan's Investment and Startup Hub
- New Incorporations: Over 5,000 in 2025 (highest among tier 2 cities)
- Startup Growth: Leading tier 2 city for new company registrations
- Sectors: AI driven SaaS, edtech, fintech
Real Estate Growth:
- Average Ticket Size 2020: ₹30 lakh
- Average Ticket Size 2024: ₹65 lakh
- Growth: Nearly doubled in 4 years
- Transaction Volume: Rising consistently
Economic Drivers:
- Urban development initiatives
- Tourism related job creation
- IT sector expansion
- Manufacturing growth
3. Ahmedabad: Gujarat's Industrial and Commercial Powerhouse
- Improving travel times across the city
- Enhancing business opportunities
- Connecting residential and commercial hubs
Industrial Focus:
- Petrochemicals and chemicals
- Shipbuilding
- Textiles
- Gems and jewelry
- Pharmaceuticals
Cost of Living:
- 1 BHK Rent: ₹8,000 to ₹25,000 per month
- Affordability: Significantly lower than tier 1 cities
- Quality of Life: Rising with infrastructure improvements
GIFT City Expansion:
- International Financial Services Centre
- Attracting global companies
- Creating high value employment
4. Coimbatore: Tamil Nadu's Manufacturing and Innovation Hub
- Cargo Volume Increase: 15 percent in 2025
- Logistics Growth: Reflecting industrial expansion
- Connectivity: Enhanced air cargo operations
Startup Ecosystem:
- TIDEL Park supporting tech startups
- Significant rise in startup count
- Focus on manufacturing innovation
- Semiconductor and R&D capabilities
Industrial Specialization:
- Multi sector innovation cluster
- Manufacturing excellence
- Engineering and automotive components
- Textile machinery
IT Sector Growth:
- Double digit hiring growth in 2026
- GCC expansion
- Technology graduate availability
5. Pune: Maharashtra's Education and IT Hub
- Metro rail network expansion
- Airport upgrades
- Highway connectivity improvements
IT and GCC Presence:
- Major IT companies established
- GCC expansion ongoing
- Startup ecosystem thriving
Real Estate Market:
- Strong demand from IT professionals
- Premium housing segment growth
- Rental market robust
6. Surat: Gujarat's Diamond and Textile Capital
- Under construction
- Will reduce regional travel times
- Enhancing logistics connectivity
Economic Strengths:
- Diamond cutting and polishing (90 percent of world's diamonds)
- Textile manufacturing
- Chemical industry
- Petrochemicals
Business Activity:
- Part of Gujarat's 60 percent share in tier 2 launches and sales
- Strong MSME presence
- Export oriented industries
7. Nagpur: Central India's Logistics Hub
- Geographic center of India
- Multi modal logistics parks planned
- Dedicated Freight Corridor connectivity
Infrastructure Challenges:
- Water shortage issues requiring attention
- Ongoing infrastructure upgrades
Economic Focus:
- Logistics and warehousing
- Manufacturing
- Agro processing
8. Bhubaneswar: Odisha's Smart City and IT Destination
- Active smart city projects
- Digital infrastructure development
- IT sector growth
Semiconductor Hub:
- Emerging as semiconductor R&D center
- Technology innovation focus
Market Performance:
- Experienced 26 percent sales decline in Q3 2025
- Market correction phase
- Long term potential remains strong
9. Visakhapatnam: Andhra Pradesh's Port and Industrial City
- Major port infrastructure development
- Industrial growth linked to port activities
- Export import facilitation
IT Sector:
- Double digit hiring growth in 2026
- GCC presence expanding
- Technology talent availability
Industrial Base:
- Steel and heavy industries
- Petrochemicals
- Pharmaceuticals
10. Lucknow: Uttar Pradesh's Administrative and Cultural Capital
- $10 billion FDI pledges from investor summits
- Government focus on industrial development
- Infrastructure upgrades
Real Estate:
- Rising transaction volumes
- Healthy end user demand
- Affordable housing segment strong
Economic Drivers:
- Government employment
- IT and ITES sector growth
- Manufacturing expansion
Key Growth Drivers for Tier 2 Cities
1. IT Sector and Global Capability Centers (GCCs)
GCC Expansion Statistics:
- 2019 Share: 5 percent in tier 2 cities
- 2025 Share: 7 percent in tier 2 cities
- Total GCCs: Over 170 across 18 tier 2 cities
- Focus Areas: AI, data engineering, software R&D, cloud, cybersecurity
Cost Advantages:
- Operational Cost Savings: 20 to 30 percent compared to tier 1 cities
- Real Estate Savings: Lower office space costs
- Salary Savings: Approximately 25 percent lower employment costs
- Attrition Rates: 20 to 30 percent lower than tier 1 hubs
Talent Availability:
- Technology Graduates: 60 percent from tier 2 and 3 cities
- Skilled Workforce: Large pool of engineering and technology talent
- Digital Skills: Growing availability of digitally skilled professionals
Hiring Growth:
Cities like Visakhapatnam, Coimbatore, Indore, Jaipur reporting double digit hiring growth in 2026
IT and ITES sector leading employment generation
2. Manufacturing and Industrial Growth
MSME Presence:
- Registered MSMEs: 51 percent in tier 2 and 3 cities
- Sectors: Textiles, food processing, electronics, pharmaceuticals
- Job Creation: Significant employment generation
Production Linked Incentive (PLI) Schemes:
- Total Distribution: ₹21,534 crore
- Beneficiary Sectors: Electronics, pharmaceuticals, textiles, food processing
- Impact: Attracting manufacturing investments to tier 2 cities
Specialized Manufacturing Hubs:
- Ahmedabad: Petrochemicals, textiles, pharmaceuticals
- Coimbatore: Engineering, automotive components, textiles
- Surat: Diamonds, textiles, chemicals
- Nagpur: Logistics, agro processing
Logistics Infrastructure:
- Warehousing Share: 36 percent of new lease volumes (up from 22 percent in 2021)
- Dedicated Freight Corridors: Reducing transit times by up to 40 percent
- Multi Modal Logistics Parks: Over 35 planned in tier 2 cities
3. Startup Ecosystem and Innovation
Startup Incorporation Statistics:
- Share Since 2020: Over 50 percent of new company incorporations
- Jaipur Leadership: Over 5,000 new incorporations in 2025
- Coimbatore Growth: Significant startup count increase
Key Startup Sectors:
- AI driven SaaS platforms
- Edtech solutions
- Fintech innovations
- Agritech applications
- Deep tech and industrial automation
- B2B e-commerce platforms
Support Infrastructure:
- TIDEL Parks (Coimbatore and other cities)
- Incubation centers
- Government startup schemes
- Angel investor networks
4. Infrastructure Development
Smart Cities Mission:
- Total Allocation: Over ₹1.47 lakh crore
- Beneficiary Cities: Multiple tier 2 cities
- Focus Areas: Digital infrastructure, urban mobility, water management, waste management
Metro Rail Projects:
- Ahmedabad metro expansion
- Other tier 2 cities planning metro systems
- Improving intra city connectivity
Airport Development:
- Coimbatore cargo volume up 15 percent
- Multiple tier 2 cities upgrading airports
- Enhanced air connectivity
Highway and Expressway Projects:
- Surat Chennai Expressway under construction
- Dedicated Freight Corridors operational
- PM Gati Shakti initiative improving connectivity
Digital Infrastructure:
- Data Center Capacity: 82 MW (6 percent) in tier 2 and 3 cities
- Projected Capacity 2030: 300 to 400 MW
- 5G Rollout: Expanding to tier 2 cities
- Fiber Optic Networks: Improving internet connectivity
5. Cost of Living Advantage
Housing Cost Comparison:
- Tier 2 Average: ₹3,800 per sq ft (Mysuru example)
- Tier 1 Average: ₹7,500 per sq ft (Bengaluru example)
- Savings: Approximately 50 percent lower
Rental Costs:
- Tier 2 (1 BHK): ₹8,000 to ₹25,000 per month
- Tier 1 (1 BHK): ₹15,000 to ₹60,000 per month
Monthly Living Expenses:
- Tier 1 Cities: ₹30,000 to ₹60,000 (Mumbai example)
- Tier 2 Cities: ₹12,000 to ₹50,000 (Hyderabad, Chennai examples)
- Comfortable Income: ₹1,00,000 monthly provides better lifestyle in tier 2 cities
Most Affordable Tier 2 Cities:
- Mysuru
- Coimbatore
- Indore
- Jaipur
- Chandigarh
Real Estate Investment Opportunities in Tier 2 Cities
Property Price Appreciation Trends
Historical Performance:
- Mysuru: 7.5 percent year on year (Q2 2025)
- Bengaluru (Tier 1): 5 percent year on year (Q2 2025)
- Jaipur Ticket Size: Doubled from ₹30 lakh (2020) to ₹65 lakh (2024)
Market Dynamics (Q3 2025):
- Sales volume down 4 percent but sales value up 4 percent
- Indicates shift towards premium properties
- Rising input costs pushing prices higher
- Moderating sales momentum but stable value growth
Future Projections:
- Indore: 8 to 12 percent CAGR (2026 to 2030)
- Tier 2 Average: Expected to outperform tier 1 in percentage terms
- Premium Housing: Significant growth expected in tier 2 and 3 cities
Investment Advantages
Lower Entry Barriers:
- Property prices 50 percent lower than tier 1 cities
- Affordable land costs for developers
- Lower population density allowing better planning
Higher Appreciation Potential:
- Percentage appreciation often higher than tier 1 cities
- Infrastructure development driving value growth
- Limited supply in organized segments
Rental Yields:
- Competitive rental yields
- Growing tenant demand from IT and manufacturing professionals
- Corporate relocations creating rental demand
Developer Interest:
- Major developers entering tier 2 markets
- Premium housing projects launching
- Quality construction standards improving
Conclusion: The Tier 2 Transformation
Tier 2 cities are no longer the second choice but the smart choice for investors, businesses, and professionals in 2026. With over 70 percent of India's urban population, 51 percent of registered MSMEs, and projected revenues of $2 trillion by 2030, these cities are powering India's next urban boom.
The combination of lower costs (20 to 30 percent operational savings), growing infrastructure (₹1.47 lakh crore Smart Cities allocation), expanding employment (double digit hiring growth in IT hubs), and improving quality of life makes tier 2 cities the engines of India's economic transformation.
From Indore's smart city leadership to Jaipur's startup ecosystem, from Ahmedabad's industrial prowess to Coimbatore's manufacturing innovation, tier 2 cities are writing India's growth story. With property prices 50 percent lower than tier 1 cities but appreciation rates often higher, the investment case is compelling.
As India marches towards 50 percent urbanization by 2050, tier 2 cities will absorb the majority of the 200 million new urban residents. The urban boom is not coming to tier 2 cities; it is already here, powered by data, driven by infrastructure, and sustained by opportunity.
For investors, businesses, and individuals looking at India's future, the message is clear: the next decade belongs to tier 2 cities.